December 8, 2020
How to choose equity funds that can do well?

Shailesh Saraf
Managing Director, Dynamic Equities Pvt. Ltd.
Traditionally all the analysis on Equity Mutual Funds are done on the basis of past returns and risk ratios only. This might lead to a query whether the past performance of a fund guarantees future success. Generally, people glance at the holdings of the Equity Mutual Funds, but they do not select schemes on the basis of these holdings. This understanding gave me an opportunity to bring a great concept to identify fundamentally good Equity Mutual Funds and led me to create – Quality Business Score (QBS) for all Equity Funds. This is a score given to each fund on the basis of their holdings (NSE listed stocks), backed by a well-equipped research data.
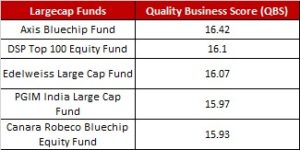
Top 5 QBS Funds in Large Cap category are (as per Oct’20 Holdings)
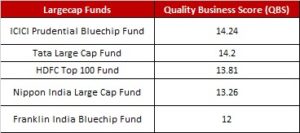
Bottom 5 QBS Funds in Large Cap category are (as per Oct’20 Holdings)
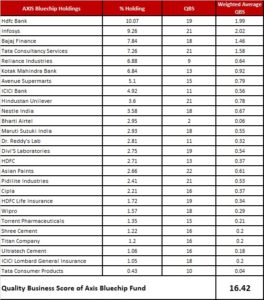
How Quality Business Score (QBS) of 16.42 of Axis Blue-chip Fund was calculated (Table 1)
Understanding Quality Business Score for each Stocks:
The QBS is made from 4 strong fundamental factors –
1. Annual Sales Growth
2. Annual EPS (or Net Profit) Growth
3. Return on Equity (ROE)
4. Free Cash Flow for last 5 years.
In order to add the recent fundamentals, we have added the latest Quarterly Sales Growth (YOY) and Quarterly EPS Growth (YOY).
Thus, maximum QBS score for any Equity Stock can be 22.
As 5 yrs = 20 (4 parameters for each yr) + latest quarter =2 parameters.
Thus, maximum QBS score for any Equity Stock can be 22.
As 5 years = 20 (4 parameters for each yr) + latest quarter =2 parameters.
Let’s Study Infosys QBS Score.
Last 5 Years Sales Growth of Infosys is:
- 2019-20 Sales Growth was 9.82%
- 2018-19 EPS Growth was 17.23%
- 2017-18 Sales Growth was 2.98%
- 2016-17 Sales Growth was 9.68%
- 2015-16 Sales Growth was 17.11%
As Sales Growth in each year was positive, thus Infosys got 5 marks.
Last 5 Years EPS Growth of Infosys:
- 2019-20 EPS Growth was 10.17%
- 2018-19EPS Growth was -3.64%
- 2017-18EPS Growth was 17.41%
- 2016-17EPS Growth was 6.41%
- 2015-16EPS Growth was 9.43%
As EPS Growth in each year was positive except for 2018-19, thus Infosys got 4 marks.
Last 5 Years Return on Equity above 15% of Infosys is:
- 2019-20 Return on Equity was 25.65%
- 2018-19 Return on Equity was 23.80%
- 2017-18 Return on Equity was 24.09%
- 2016-17 Return on Equity was 22.03%
- 2015-16 Return on Equity was 23.99%
As Return on Equity in each year was above 15 in Infosys got 5 marks.
Last 5 Years Free Cash Flow* of Infosys is:
- 2019-20 Free Cash Flow was Rs. 13046crs
- 2018-19 Free Cash Flow was Rs. 11808crs
- 2017-18 Free Cash Flow was Rs. 9996crs
- 2016-17 Free Cash Flow was Rs. 8038crs
- 2015-16 Free Cash Flow was Rs. 6706crs
As Free Cash Flow in each year was positive Infosys got 5 marks.
*Free Cash Flow is taken for 2 years average.
For latest growth we will take latest Quarter Sales Growth and Quarterly EPS Growth for 2020 September Quarter result:
- Sep Quarter Sales Growth (YOY) 8.58%
- Sep Quarter EPS Growth (YOY) 20.49%
As both Quarter EPS and Sales Growth are Positive, we will provide 2 marks.
Thus, Infosys got 21 marks in fundamentals. Similarly, we will make the QBS score for all NSE listed stocks in the holdings of Equity Mutual Funds. Then we calculate the weighted average QBS score as per the holding percentage of each stock in the Equity mutual fund and provide QBS for the Fund as shown above in Table 1 for Axis Bluechip fund.
Final thought for selecting future top funds
QBS for all the funds is calculated every month after the fund houses declare their holdings. Thus, if in the Large Cap category, funds which stay in top 4 as per QBS for 4 consecutive months, then those funds are most likely to be in the top 5 performing funds (return wise) for the next 1 year compared to funds with low QBS. This has been comprehensively proven by our extensive predictive analytics. One needs to watch out that a low QBS score is a red flag and may lead to underperformance compared to other funds in any category.
(Views expressed and ideas discussed in this article are solely of the author, based on his research methodology)
Could this be further refined as Sales Growth of 2.98% and 17.23% both are earning equal marks I. e. 1 and likewise for other parameters also. There should be some other parameters for scrips like Reliance and Bharati as on scrip level they have doubled and quadrupled. And likewise in other seemingly shockers which are not driven by these parameters. Just a suggestion.
very useful to distributor to use this strategy for selecting